Control generator | Name | Description |
|---|---|---|
| Constant | This BC generates a constant value during a dynamic simulation. Default value is 75 |
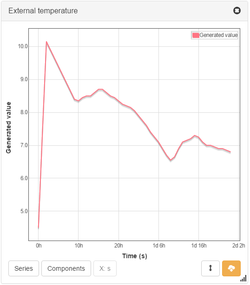
| External temperature | This BC generates a external temperature during a dynamic simulation
|
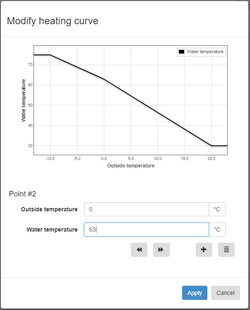
| Heating curve | The heating curve gives a supply temperature according to the external temperature. All points on the heating curve are fully customizable.
|
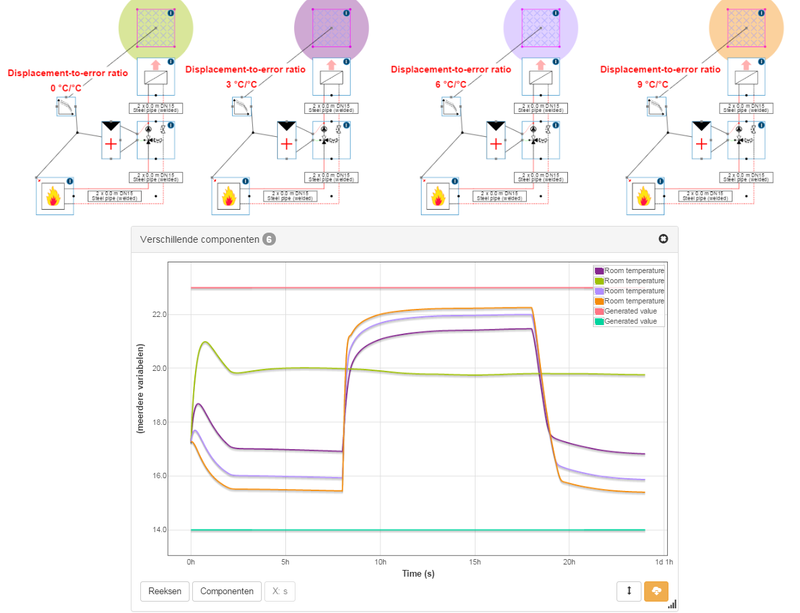
| Heating curve with displacement | When using a standard heating curve there is no feedback from the rooms, so the room temperature maintains 20°C. The heating curve with displacement uses a temperature measurement in a reference room to adjust the heating curve so the supply temperature rises. All points on the heating curve and the displacement-to-error ratio are fully customizable.
|
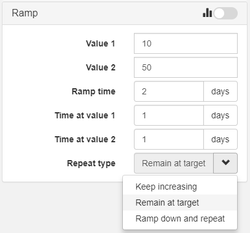
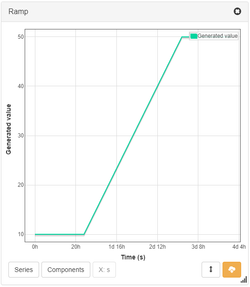
| Ramp |
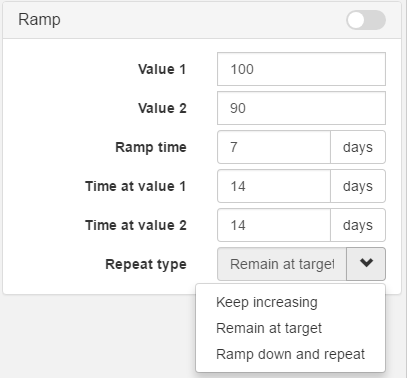
This BC generates a ramp depending on the data that is entered.
| ||
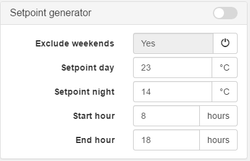
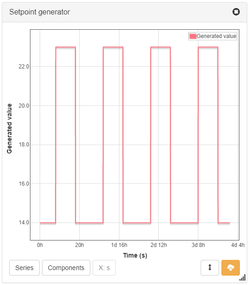
| Setpoint generator | This BC generates a square wave depending on the data that is entered.
|
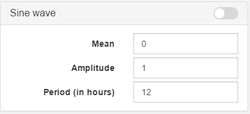
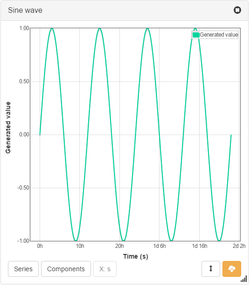
| Sine wave | This BC generates a sinus wave depending on the data that is entered.
|
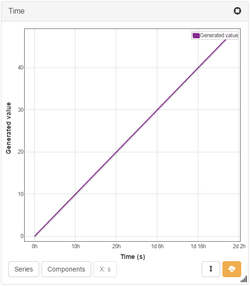
| Time | This BC generates the simulation time during a dynamic simulation. For example if you simulate for 2 days, a linear graph will be generated from 0h to 48h.
|
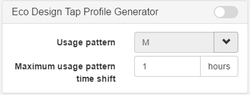
| Eco design tap profile generator |
|
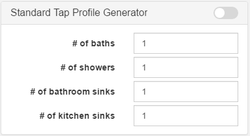
| Standard tap profile generator |
|
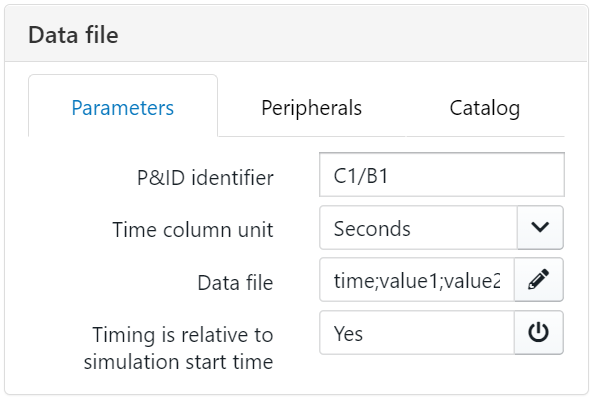
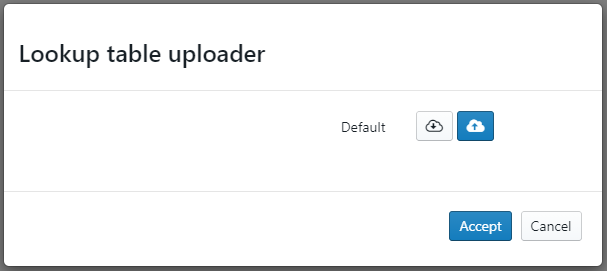
| Data file | This BC generates values depending on the time it occurs. The user should insert the desired values and times in the data file. By clicking on the pencil icon next to the parameter "data file" a pop-up window appears where the user can extract the .csv file template by clicking on the white cloud button with the arrow pointing down.
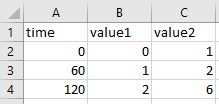
The user can then enter the desired data in the .csv file. The amount of "value" columns can't be more than 4 because the amount of control nodes on the BC is 4. The time entered in the data file can be set on seconds, minutes, hours, days, weeks, or months but the user should change the parameter "Time column unit" in the same way the data file was filled in.
IMPORTANT: If the inserted data is on a yearly basis (for instance weather file or load profile), the parameter "Timing is relative to simulation start time" should be set on "No" instead of "Yes". In default, the inserted data doesn't depend on the simulation start time which means if you start simulating in January or June, you will have the exact same data generated. But if you change the parameter to "No", the first value in the data file will always be on the first second of January 1st.
|
.png?version=1&modificationDate=1614242627152&cacheVersion=1&api=v2&width=500)
.png?version=1&modificationDate=1614242633057&cacheVersion=1&api=v2&width=500)